How To Use The Zig Zag Indicator
The zig zag indicator is not built to forecast. It is made to cut the noise and help you focus on structure. Traders often worry about every minor move and end up missing the bigger picture. Zig zag filters that out and highlights the major turning points based on the size of the moves. But its real value is not in the lines, it is in what they say about how the market breathes. If those swings start getting shorter in an uptrend or stretch longer in a downtrend, that can hint the trend is shifting before it becomes obvious. In this article, we will discuss this trend-filtering indicator in detail, covering its origin, key components, and top trading strategies.
Introduction to zig zag indicator
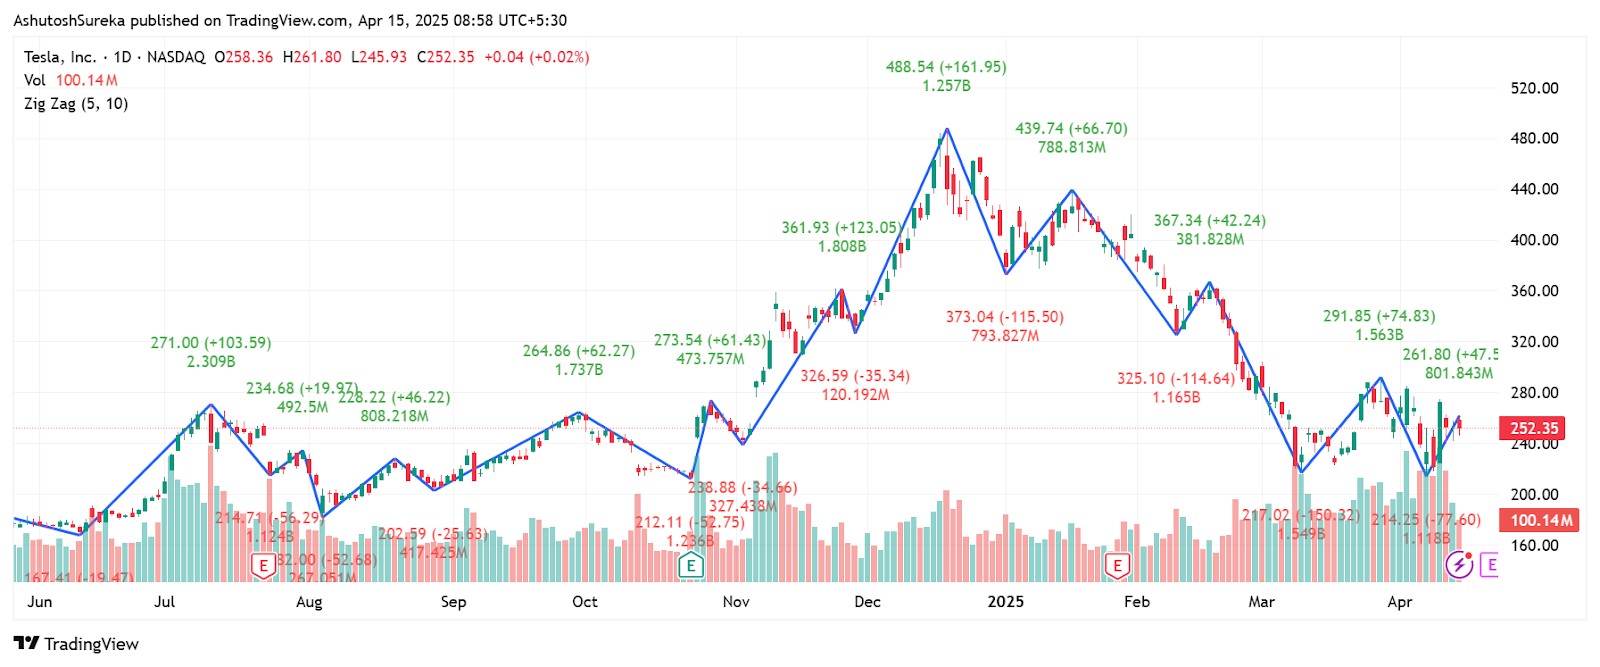
The zig zag indicator is a chart analysis tool used to filter out minor price movements and highlight major trends. It simplifies market structure by drawing straight lines between significant highs and lows, making it easier to spot patterns, swings, and overall direction.
Unlike moving averages or oscillators, this indicator does not predict future movement; it reacts only after price changes. This makes it useful for analyzing historical swings, measuring retracements, or confirming chart patterns like head and shoulders or Elliott waves.
What does zig zag show
- Filters out small, random price noise.
- Connects swing highs and swing lows with clean lines.
- Helps identify wave patterns, support and resistance levels.
- Makes trend direction and reversal zones easier to spot.
Origin and development of zig zag indicator
This trend filtering tool (zig zag) indicator has been around since the early days of technical charting. It was created to help analysts and traders visually separate meaningful market moves from insignificant fluctuations. Though it isn’t attributed to a specific person, it evolved over time through early market theory and price action analysis.
Why it was introduced
- Traders needed a way to reduce chart clutter and highlight clean price movement.
- The tool was designed to ignore minor fluctuations and help focus on key swing points.
- It became popular as part of Elliott Wave Theory and pattern recognition strategies.
How it became useful
- Originally used in manual chart drawing, later built into charting platforms.
- Became a core part of swing trading, wave analysis, and pattern studies.
- Still widely used to confirm structure, measure retracement levels, and analyze past trends.
Understanding the components of zig zag indicator
Zig zag indicator is built around one simple idea: filtering out smaller price movements and focusing only on major turning points. It does this by connecting significant highs and lows based on a set percentage or value, making the chart easier to read for trend and pattern recognition.
Although it appears as just a set of angled lines on the chart, this indicator depends on a few core components that control how it behaves and what it shows.
Key components of zig zag
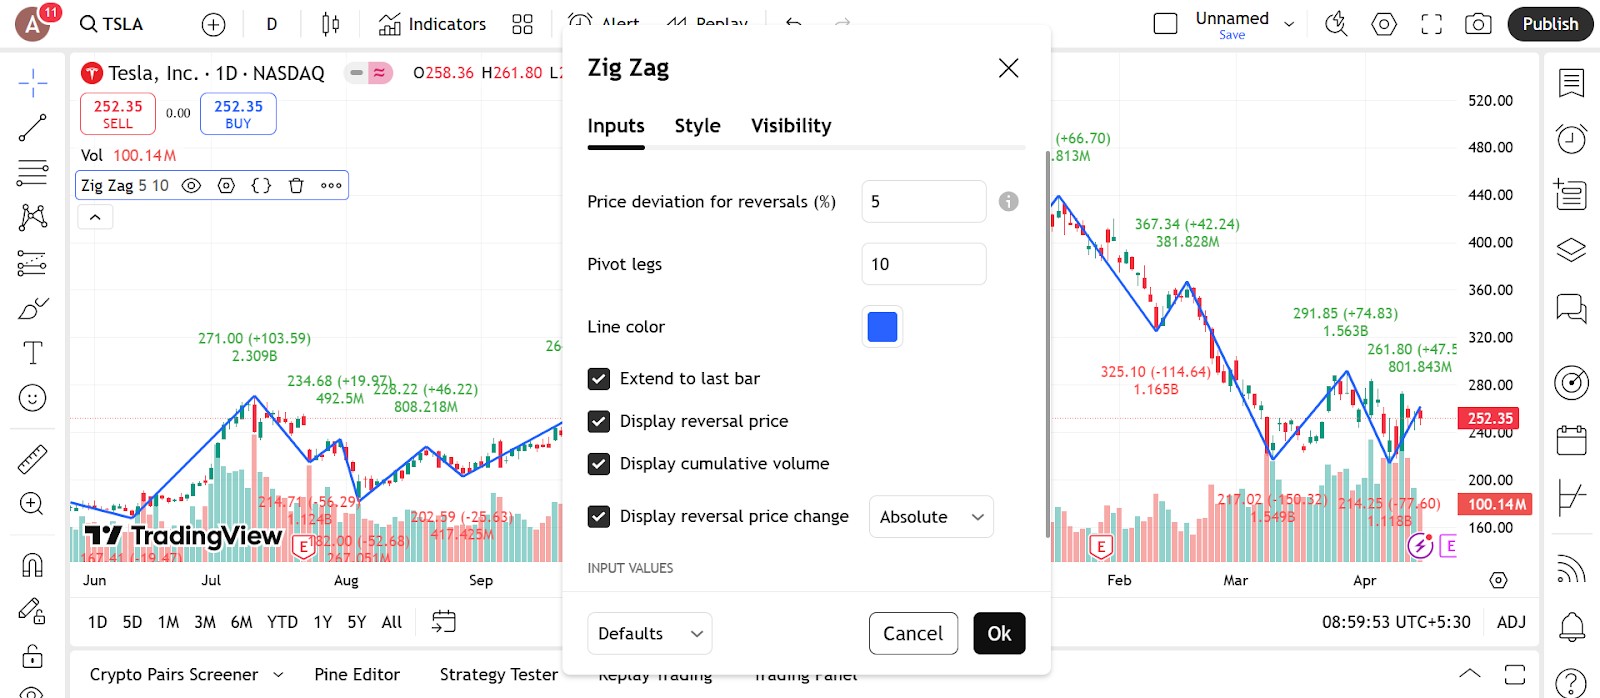
1. Deviation or threshold
- This setting defines the minimum price change needed for the indicator to draw a new line.
- It can be set as a percentage (like 5 percent) or in points.
- If the price does not move beyond this amount, the indicator ignores it.
2. Depth or lookback period
- This controls how far back the indicator searches to find highs and lows.
- A longer depth smooths the chart and focuses on major swings.
- A shorter depth makes the indicator more sensitive to smaller moves.
3. Reversal amount
- This value tells the indicator when to switch direction and plot the next leg.
- For example, if set to 10 percent, the price must reverse by at least 10 percent from a high or low for the next point to be drawn.
- It helps determine when a swing is large enough to matter.
How it all works together
- The tool starts by plotting the first confirmed high or low.
- It then connects the next valid swing only if the price has changed enough based on the reversal setting.
- The result is a cleaner view of the trend, removing minor fluctuations that distract from the big picture.
How to apply zig zag on a chart
Zig zag indicator is available on most trading platforms and is very easy to use. It draws lines between key highs and lows based on a set percentage or point change. Once added to the chart, you can adjust the sensitivity using a few simple settings.
Access the indicator
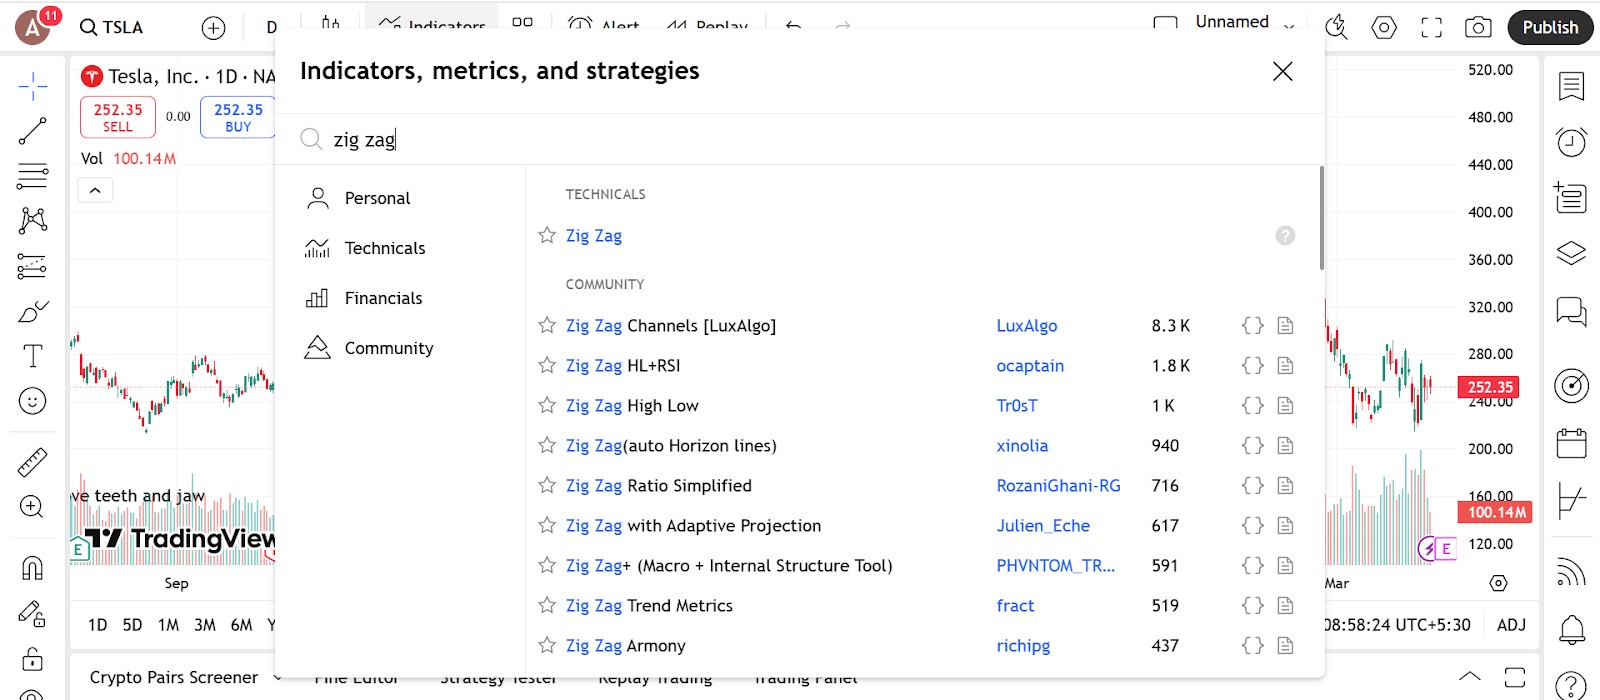
Setting up the Zig Zag indicator on your chart is simple and quick.
Steps to follow
- Open the indicators or tools section on your trading platform.
- Search for “Zig Zag” in the available options.
- Select and apply it to your chart; the line will show in a separate panel beneath the main chart area.
Platform availability
You will find Zig Zag already built into platforms like TradingView, MetaTrader 4 and 5, ThinkorSwim, and most major charting software; no extra downloads or installations needed.
Changing the inputs

While the indicator is simple, tuning the parameters helps match it to your timeframe and strategy.
What you can adjust
- Deviation (percentage or points)
Sets the minimum move required before a line is drawn. A higher value means fewer, more meaningful swings. - Depth (or lookback)
This defines how far back the tool looks to compare price. A longer depth gives a smoother line that focuses only on larger moves. - Backstep (if available)
A setting used in some versions of zig zag to prevent very small reversals from being counted
Tips for setup
- Use a higher deviation on higher timeframes to avoid noise.
- Test on different charts to see which values give a clean, useful structure.
- Combine with Fibonacci, support and resistance, or trendlines for better trade setups.
Trading strategies using zig zag indicator
Zig zag is a great tool for identifying market structure, spotting patterns, and filtering out noise. While it doesn’t give signals on its own, it works well when combined with support and resistance levels, Fibonacci tools, or candlestick formations. Traders mainly use it to analyze trends, confirm breakouts, and measure pullbacks.
Fibonacci retracement with zig zag confirmation
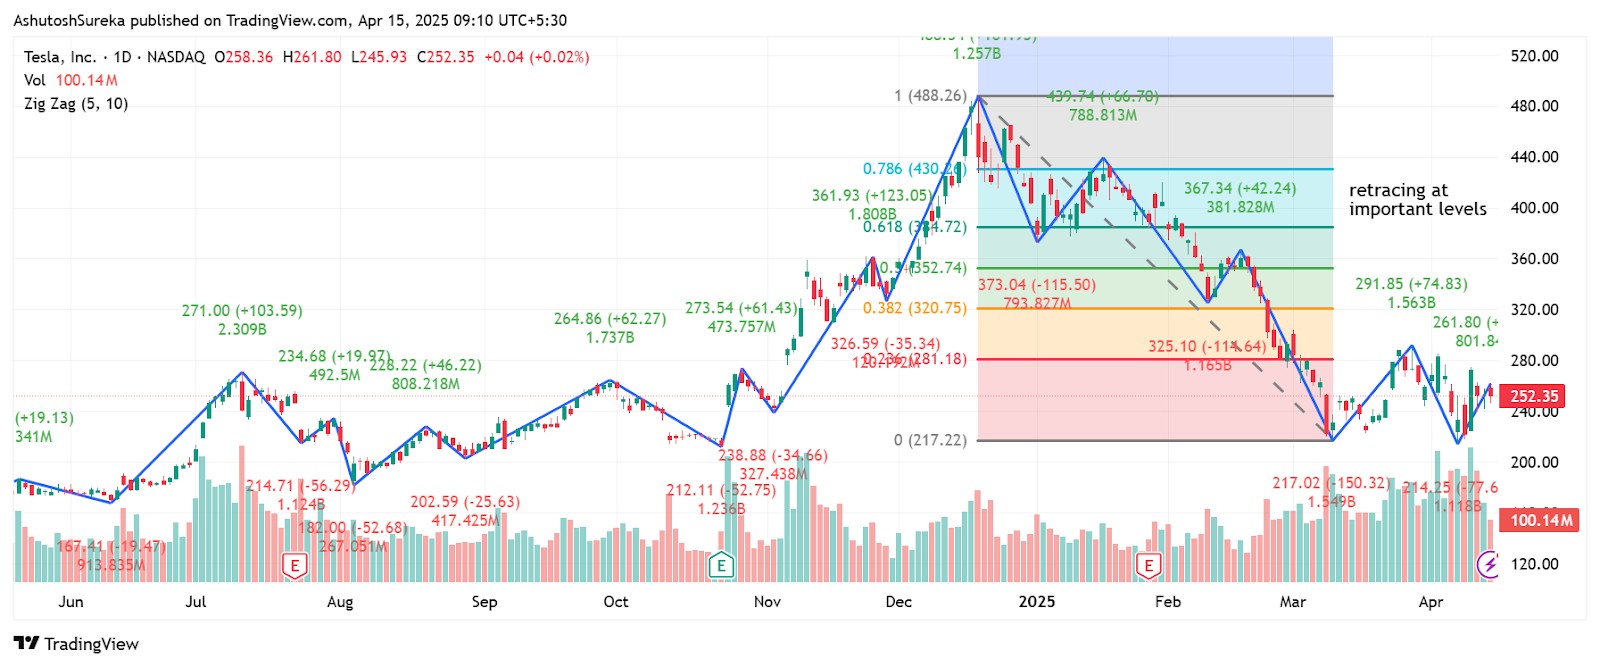
Zig zag helps mark the swing points needed to draw accurate Fibonacci levels.
How to apply it
- Use the tool to mark a clear high and low.
- Draw a Fibonacci retracement from swing low to swing high (or vice versa).
- Watch for price to react at 38.2, 50, or 61.8 levels.
- Confirm with a bounce or candlestick signal.
Why it helps
- Avoids guessing on where to draw your Fib levels.
- Matches structure with common retracement zones.
- Gives more confidence in pullback trades.
Chart pattern recognition strategy
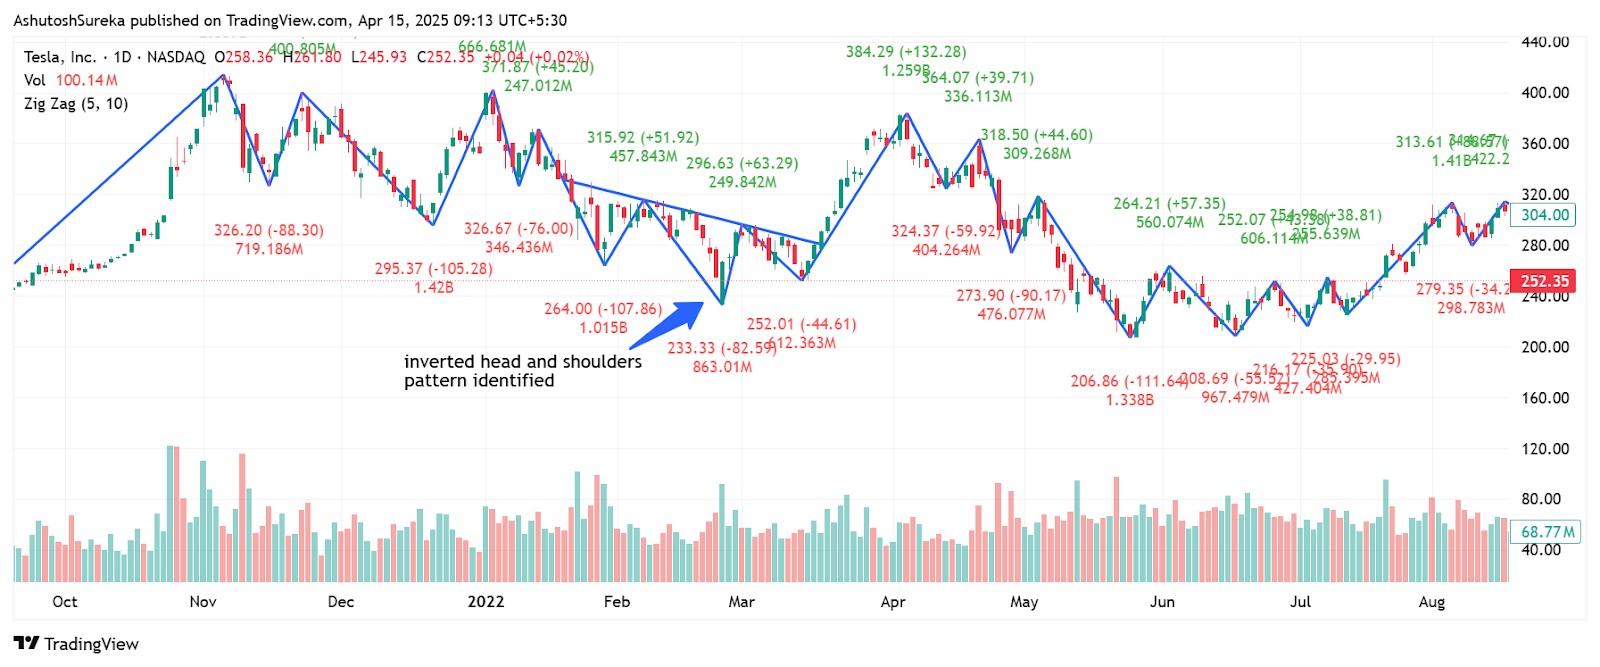
Zig zag makes it easier to see patterns like double tops, head and shoulders, or triangles.
How to apply it
- Let zig zag outline the price structure.
- Look for repeating shapes like M and W patterns, triangles, or channels.
- Wait for a breakout beyond the pattern before entering.
- Use price action to time your entry and stop placement.
Why it helps
- Clears up the visual clutter on your chart.
- Makes pattern spotting faster and more accurate.
- Great for traders who prefer structure-based setups.
Traders who depend on multiple technical indicators should consider brokers that provide access to platforms like TradingView, MT5, or cTrader. These platforms come equipped with a wide range of professional charting tools and indicators that suit nearly any trading style.
Pros and cons of zig zag indicator
Pros
- Filters out market noise. The indicator cuts through small, random price movements and focuses only on major highs and lows. This makes it easier to see what’s really happening without getting distracted by minor fluctuations.
- Makes trend structure clearer. It connects turning points with clean lines, which helps you spot higher highs, lower lows, and overall trend direction. This is useful for identifying reversals or confirming ongoing moves.
- Supports pattern recognition. Zig zag lines simplify chart patterns like head and shoulders, double tops, or channels. You can spot these more easily when price is outlined with clear swings.
- Helps with drawing Fibonacci levels. It gives you clean reference points for swing highs and lows, which makes it easier to apply Fibonacci tools accurately and with confidence.
Cons
- Lagging by design. The zig zag only draws after the price has moved by a set amount, so it shows what happened in hindsight. This means you can’t rely on it for real-time entries.
- Not suitable for standalone signals. It doesn’t give buy or sell signals on its own. You need to combine it with price action, volume, or other tools to make informed decisions.
- Can repaint with new price action. As new candles form, the indicator may shift or adjust recent lines. This can be confusing if you’re using it for live decision-making without understanding how it works.
- Highly sensitive to settings. If your deviation or depth settings are too low, it may show too many swings. If they’re too high, it may miss key turns. Tuning it takes trial and error based on timeframe and asset.
Conclusion
The zig zag indicator is not meant to show you entry points. It is there to help you feel the pace of the market. When you start using it to understand how each move behaves, how far it runs, how quickly it turns, and how that compares to the last leg, you stop reacting and start observing. A steady run with deeper dips says something different than a sharp rally with no follow-through. Each move has meaning.zig zag becomes a way to listen to price and see when a trend is pushing hard or fading quietly. It is a tool that shows how strong the move really is underneath the surface.
Post a comment