How To Use the Heiken Ashi in Trading?
The Heiken Ashi technique can be helpful for traders aiming to enhance their chart analysis. The crux of the issue lies in the volatile nature of these markets, where traditional charting methods sometimes fall short in filtering out the noise, leading to hasty decisions.
How does Heiken Ashi work?
Heiken Ashi, a term derived from Japanese, meaning “average bar”, transforms the way we look at price charts.
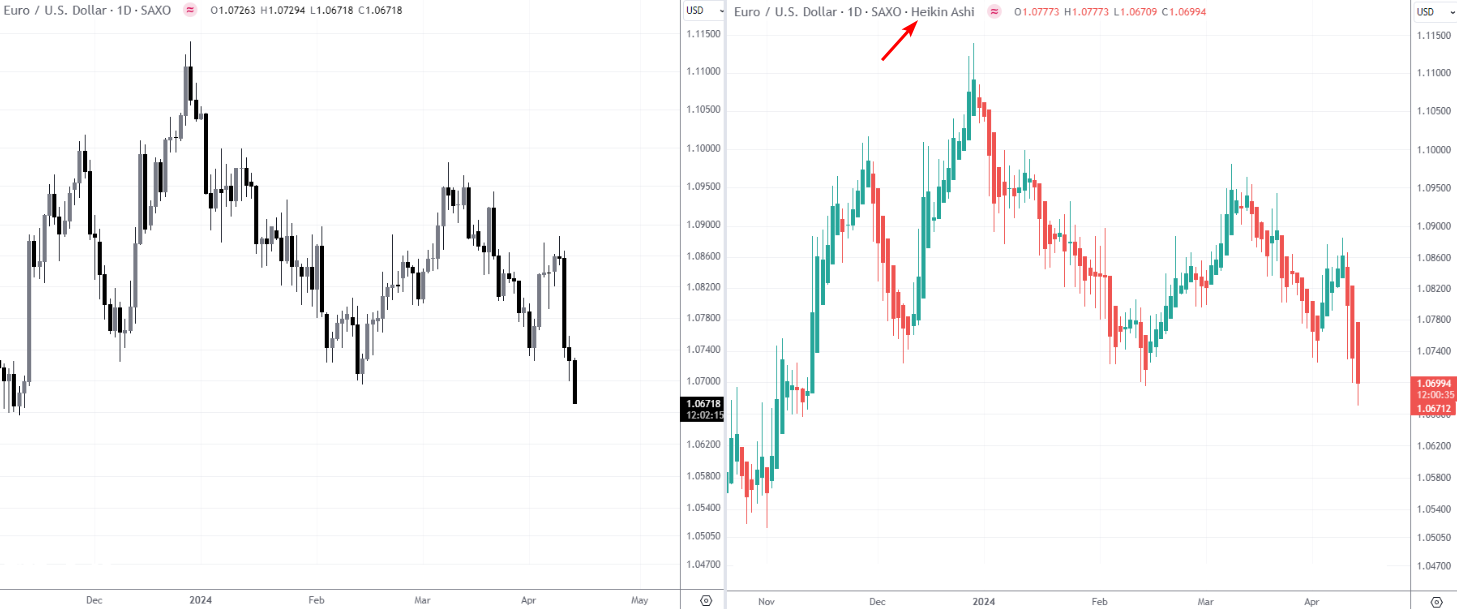
Daily EUR/USD Chart: Classical candlesticks (left) vs Heiken Ashi (right)
Unlike traditional candlesticks, which focus on opening, closing, high, and low prices within a specific timeframe, Heiken Ashi candles take a different approach. They calculate average values, providing a smoother visualization of the market trend.
Formula:
The Heiken Ashi formula recalculates OHLC price data through a set of mathematical operations, resulting in four main components:
- HA Close = (Open + High + Low + Close) / 4
- HA Open = (HA Open [previous bar] + HA Close [previous bar]) / 2
- HA High = Maximum of High, HA Open, or HA Close
- HA Low = Minimum of Low, HA Open, or HA Close
This methodology offers a cleaner view, reducing the impact of short-term fluctuations and highlighting longer-term trends.
Comparison with traditional candlesticks:
Traditional candlesticks present raw price movements within a timeframe, showcasing the battle between buyers and sellers through their bodies and wicks. While this provides a detailed picture of market sentiment during that period, it can also introduce a significant amount of noise, especially in highly volatile markets.
In contrast, Heiken Ashi's smoothed candles filter out these minor fluctuations, offering a clearer perspective on the market direction. This makes it easier for traders to identify trends and reversals without getting caught up in the minutiae of price volatility.
How to add Heiken Ashi
Let's explore how to add these candles to two popular platforms - TradingView and MetaTrader.
To TradingView:
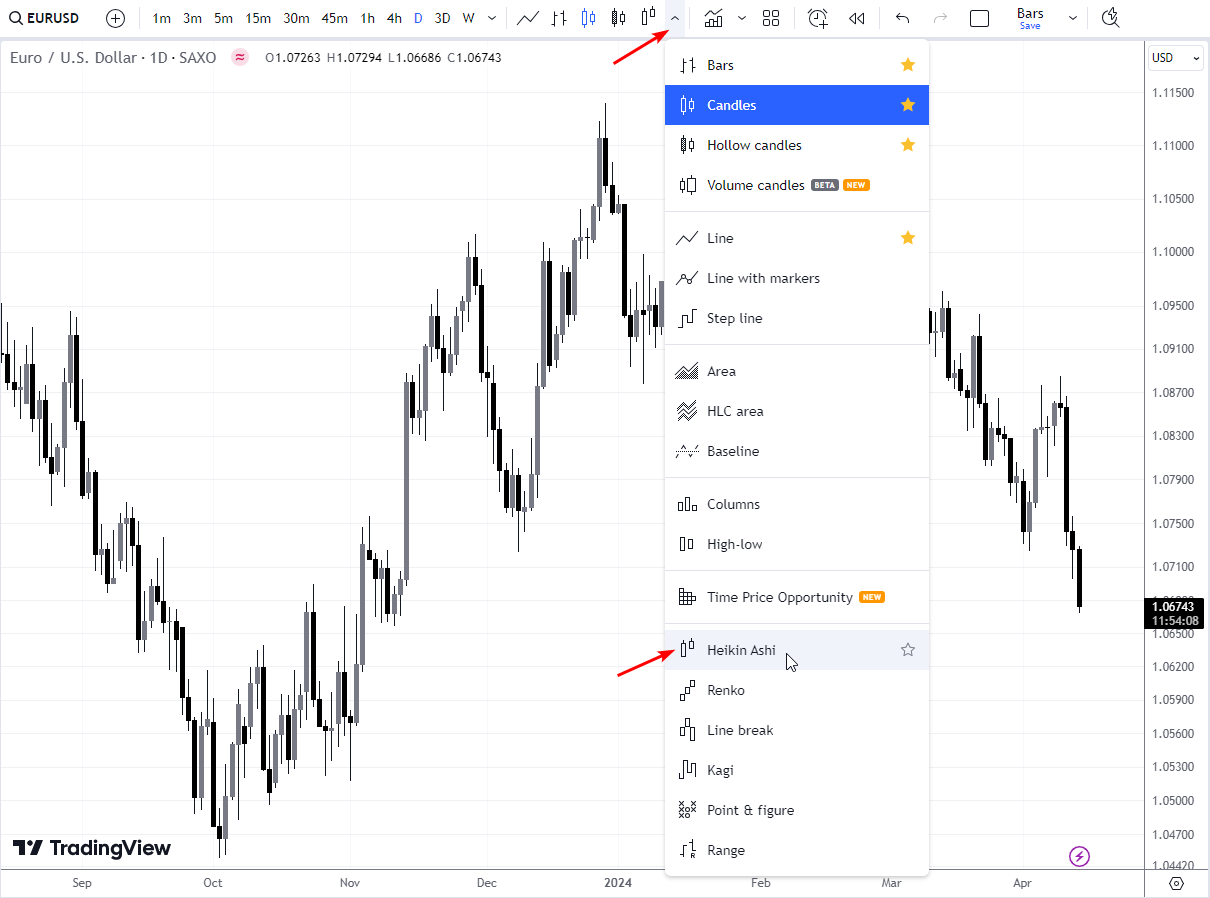
How to add Heiken Ashi to TradingView
- Open your TradingView chart.
- Go to the menu typically at the top of the chart. This should look like a candlestick or bar chart icon.
- Click on it to reveal a dropdown menu of available chart types.
- Select "Heiken Ashi" from the list.
- Your chart will immediately transform, replacing traditional candles with the smoother, streamlined Heiken Ashi candles.
Switching to the Heiken Ashi format on TradingView is a seamless process, enabling traders to quickly adjust their view for better trend analysis.
To MetaTrader:
To use a Heiken Ashi indicator, you can download it from the provided link and import it into MetaTrader 4.
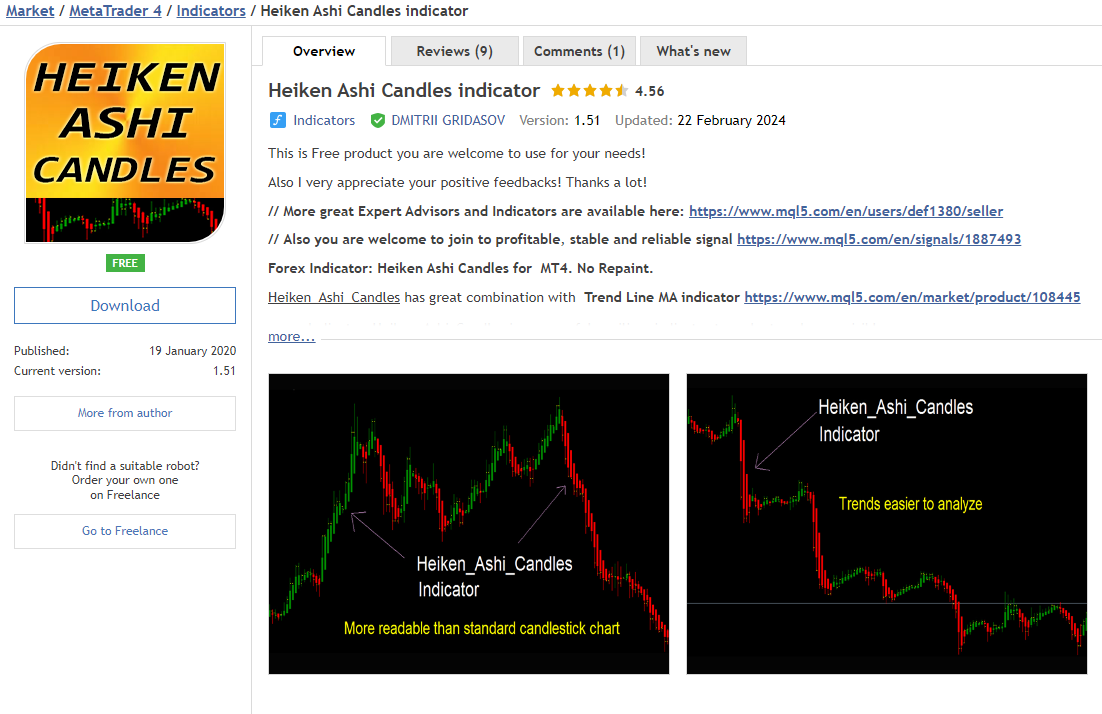
To open Heiken Ashi in MT4, you need to install a free indicator
To do this, follow these steps:
- Download the MQL5 code for the custom Heiken Ashi indicator.
- Open MetaTrader 4 and navigate to the "File" menu.
- Click on "Open Data Folder" to access the MQL5 folder.
- Navigate to the "MQL5" folder and then to the "Indicators" folder.
- Copy the downloaded MQL5 code file and paste it into the "Indicators" folder.
- Restart MetaTrader 4 to ensure that the new indicator is recognized.
- Once the indicator is loaded, you can add it to your chart by following the steps outlined above for adding a built-in Heiken Ashi indicator.
How to read Heiken Ashi candles
Heiken Ashi candles differ from traditional ones in that they highlight the trend's strength and direction more clearly.
- A series of green (or white) candles indicates a strong uptrend, particularly when the candles lack lower shadows, suggesting buyers are in control.
- Conversely, red (or black) candles signal a downtrend, especially if they lack upper shadows, indicating sellers' dominance.
Moreover, the appearance of small bodies with shadows on either side can denote a weakening trend or consolidation phase, hinting at a potential reversal or pause in the current trend. Traders should also watch for a change in candle color as a signal of a possible trend reversal.
What is the best strategy for Heiken Ashi?
A valid strategy for using Heiken Ashi candles lies in their ability to smooth out price action and reduce market noise, which is beneficial for identifying and staying with trending moves.
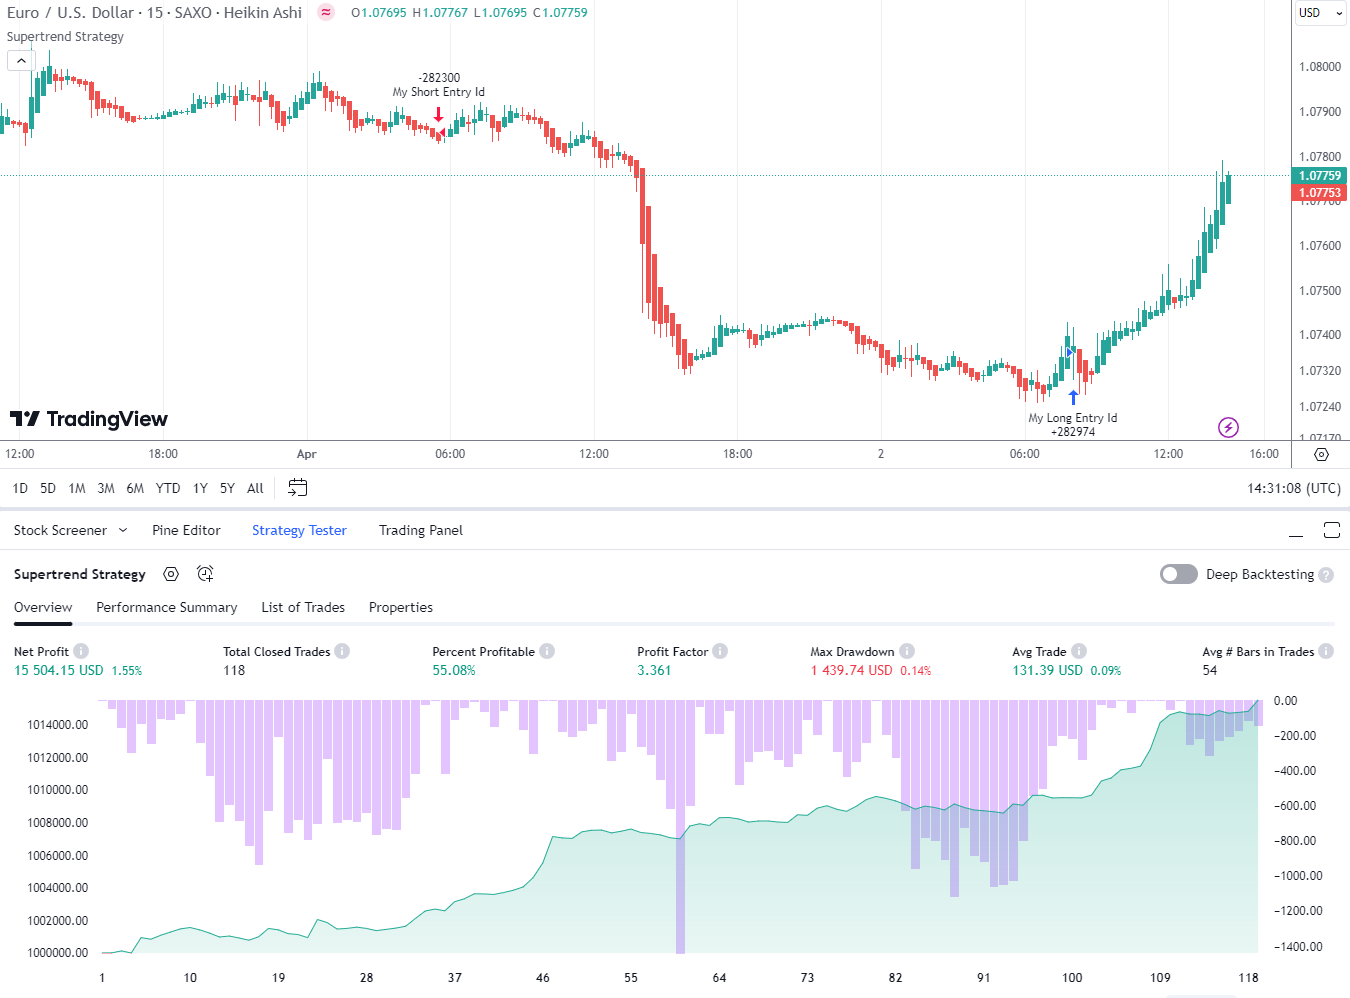
Testing a simple strategy on Heiken Ashi charts can create the illusion of profitability
However, there's a caveat when it comes to backtesting strategies based on Heiken Ashi. The candles' formulation uses average price components, which can produce a dissonance between the Heiken Ashi chart and a traditional candlestick chart.
This discrepancy becomes evident when backtesting. For instance, a Supertrend strategy might show a profit when applied to a Heiken Ashi chart due to the smoothed nature of the price action. Yet, when the same strategy is tested on classical candlestick charts, the results can starkly contrast, often indicating losses.
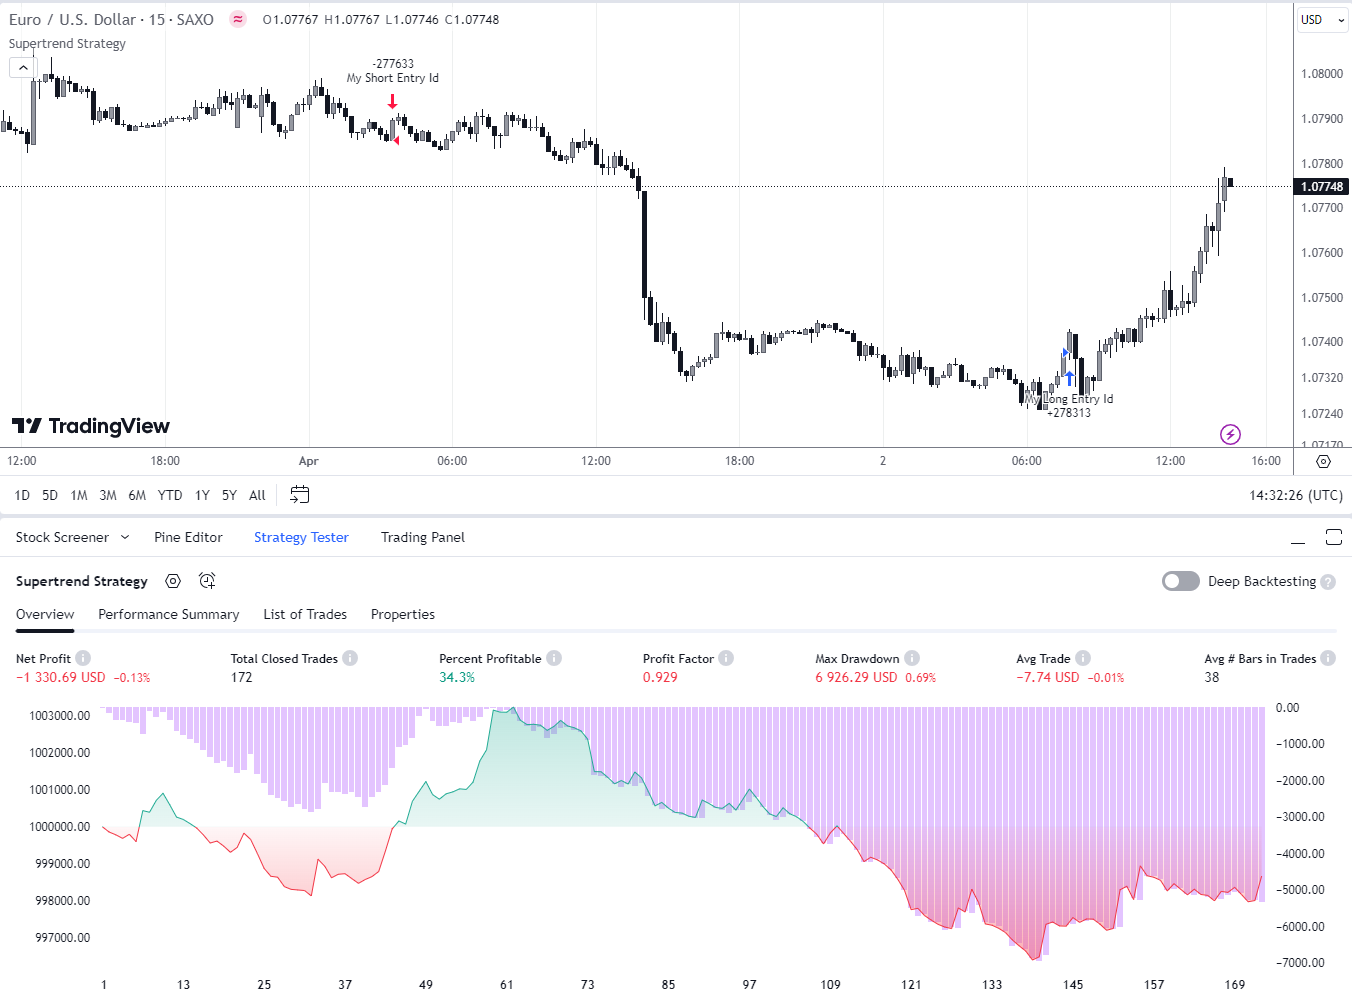
A strategy that was "profitable" when tested on Heiken Ashi charts turns out to be unprofitable on classic candlestick charts
The key takeaway is that while Heiken Ashi can provide a cleaner and seemingly more predictable trend indication, the historical testing can yield skewed results.Traders should supplement their Heiken Ashi strategies with additional market analysis techniques to confirm signals before execution.
How to trade Heiken Ashi
Since Heiken Ashi is a clean chart, you can use different ways to create trading strategies. Let's give two tips that can be used as part of your trading plan:
- Search for candlesticks without shadows.
- Be cautious of the appearance of candlesticks with narrow bodies.
Search for candlesticks without shadows
This technique can be used when building effective trading strategies for trading on Heiken Ashi charts. The essence is to search for candlesticks without long shadows.
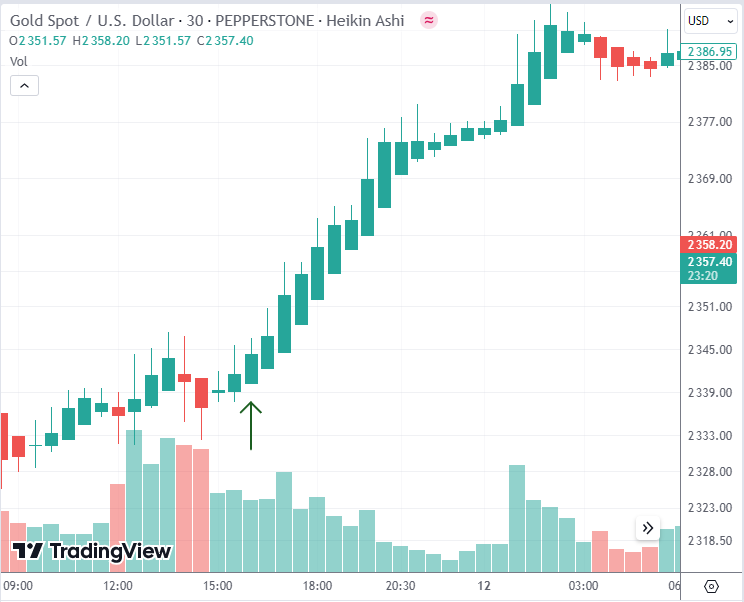
AU/USD: The first bullish candle without a lower shadow can be used as a long entry signal
Candlesticks without wicks often indicate the probable beginning of a strong trend.
Pay attention to candles with narrow bodies
Often such candles appear in low volatility conditions (during the Asian session, for example).
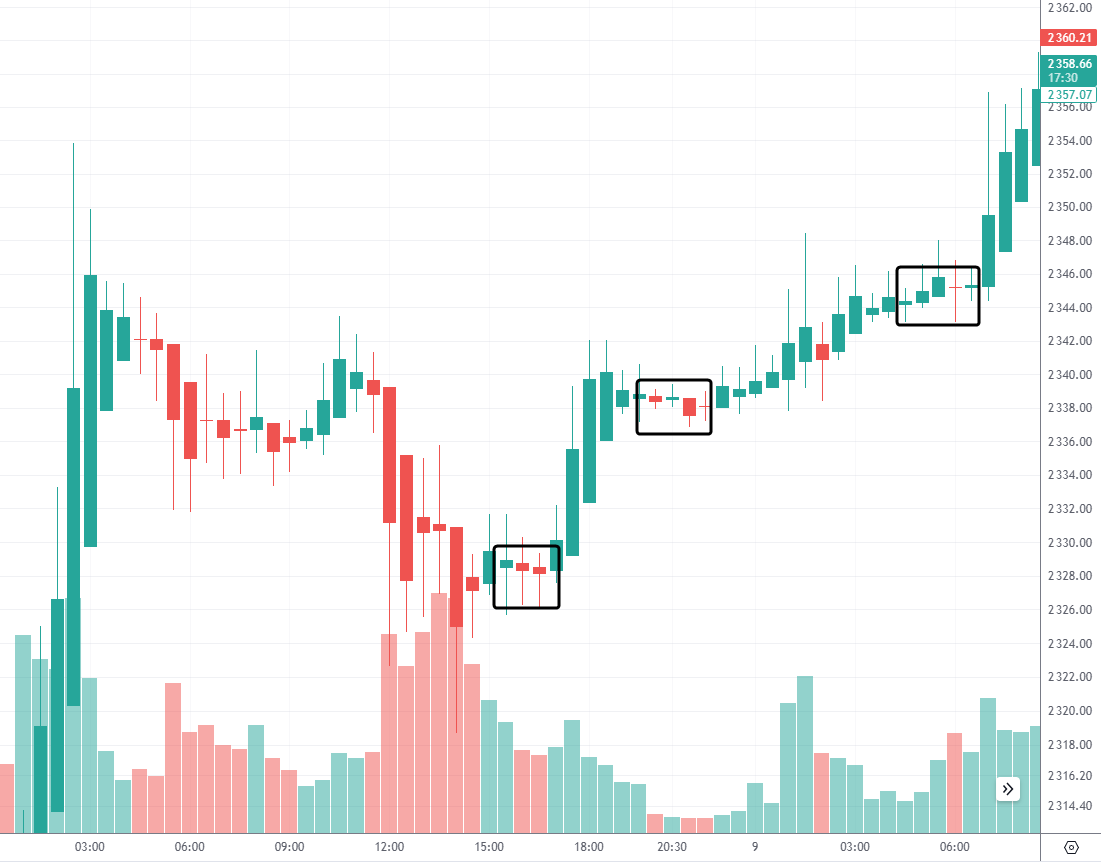
Candlesticks with narrow bodies are generally difficult to interpret
But the appearance of such candles during a regular session can be a sign of a weakening (or reversal) of the trend. At the same time, a color change on a candlestick with a narrow body may not mean a reversal, but just a pause before the main trend continues.
Summary
Heikin-Ashi charts are a valuable tool for traders looking to smooth out market volatility and identify clear trends. Their primary benefit lies in offering a more streamlined perspective on market movement, which can aid in decision-making.
However, the potential for delayed signals and loss of intricate price information are trade-offs to consider. Traders must weigh these pros and cons against their strategies and use Heikin-Ashi judiciously, in concert with other analytical tools, for optimal results.
Post a comment