
How To Use The 15-Minute Binary Option Strategy
The 15-minute binary option strategy is designed for making fast but thoughtful decisions. It merges trend study, momentum observation, and well-timed entries into a clear framework. Traders often rely on EMA, RSI, and a trusted 15-minute indicator to maintain discipline and avoid impulsive choices. The method balances quick execution with clarity, offering control and confidence for those stepping into trades.
Some dismiss the 15-minute timeframe as nothing more than guesswork, leaning on too many indicators to back their choices. Yet the true key to success lies not in speed but in detecting the subtle shifts and repeated market behaviors hidden within the noise. Each short interval carries its own rhythm, shaped by institutional movements and retail responses. The hardest part is not simply choosing direction but knowing the exact moment to engage—I’ve learned that without that timing, a trader is just reacting rather than following a plan.
Introduction to best 15-minute binary option strategy
Every session has its own character. The first quarter-hour in London or New York can dictate momentum for hours ahead. Overlaps in sessions bring energy and liquidity, while midday periods often trap traders in sideways ranges. Understanding these patterns allows alignment with the market instead of working against it. For example, the opening-range breakout technique defines the first 15-minute bar’s high and low, then waits for a decisive move; when timed well, the breakout momentum can carry trades through to expiry

Why the 15‑minute timeframe stands out
- Captures meaningful patterns quickly. Candlestick formations like engulfing patterns, pin bars or inside bars are more reliable on 15‑minute charts than on ultra‑fast one‑minute charts because they include more data without demanding all‑day patience.
- Works with session structure. The first 15‑minute range after the open provides clear support and resistance levels. Breakouts from this range often indicate the day’s directional bias, particularly in active futures or Forex markets.
- Blends well with indicator confirmation. You can combine moving averages, momentum oscillators, and volatility measures without overcrowding the chart. This allows for a disciplined 15-minute binary options strategy that is both systematic and adaptable.
Who should trade this timeframe
- Morning and evening traders. If you can trade during the first or last hour of major markets, the 15‑minute chart aligns with peak activity without staying glued to the screen all day.
- Pattern and price‑action enthusiasts. Head‑and‑shoulders reversals, double tops/bottoms and flag formations are easier to spot on 15‑minute charts and often lead to clean binary options setups.
- Algorithmic or rule‑based traders. The timeframe provides enough data to back‑test strategies such as opening range breakouts, Bollinger Band squeezes or momentum reversals.
- Wait for a decisive break with volume. A strong breakout candle, typically with little to no wicks and increasing volume, suggests real momentum. False breakouts often lack volume or stall quickly.
- Confirm with indicators. Align the breakout with moving averages (9‑EMA or 20‑SMA), VWAP or RSI above 50 for bullish trades and below 50 for bearish trades. These tools help filter out weak moves.
- Set a measured target. Experienced ORB traders often aim for a profit target 1.5–2 times the size of the opening range. For binary options, this equates to choosing an expiry that allows price enough room to reach that objective without over‑exposing you to a reversal.
- Identify the three peaks. The head should be higher than the two shoulders. Draw a neckline connecting the lows between the shoulders.
- Look for momentum divergence. If the second shoulder forms while the RSI or MACD makes a lower high, momentum is fading – a classic bearish sign. On bullish patterns (inverse head‑and‑shoulders), watch for higher lows in the oscillator.
- Trade the neckline break. Enter a put (for a normal head‑and‑shoulders) when price closes below the neckline. Set expiry for one or two candles to capture the initial momentum. If price retests the neckline and fails, it confirms the breakdown.
- Spot the squeeze. On a 15‑minute chart, wait for the bands to narrow significantly – this shows volatility has dried up. Many traders also check the Bollinger Band Width indicator to quantify the squeeze.
- Watch for expansion with volume. A breakout candle that closes outside the upper or lower band with rising volume suggests momentum. Enter in the breakout direction. To improve accuracy, confirm with an oscillator like RSI moving above 55 or below 45.
- Time your expiry. Since squeezes precede big moves, a one‑candle expiry (15 minutes) often suffices. In some cases you may hold for two candles if ATR shows the potential for a larger move.
- Mark the daily pivot (P) and the first support/resistance (S1/R1). Price often reacts to these levels during the London and New York sessions. A bounce off pivot with bullish price action can justify a call option; a failure at R1 or S1 can set up a put.
- Combine with session highs/lows. The high and low of the current session (especially after the first hour) often act as breakout points. A break above the session high with high volume suggests continuation; a false break may indicate a reversal.
- Use ATR to select expiry. If the pivot‑to‑pivot distance is large, a longer expiry (two candles) may be warranted; if small, stick to one candle.
Best 15-minute binary option strategies
Opening range breakout, trade the day’s first move
The strategy known as the opening range breakout has been used by futures traders for decades. It involves tracking the market for the first 15 minutes after the open, marking the highest high and lowest low, and waiting for a breakout.

Head‑and‑shoulders reversal with divergence
A head‑and‑shoulders pattern on the 15‑minute chart signals a potential trend reversal. To trade it effectively.

Bollinger band squeeze and expansion

Bollinger Bands measure volatility via two standard‑deviation bands around a moving average. A squeeze occurs when the bands contract, indicating low volatility. An expansion often follows, leading to strong directional moves.
Pivot‑point and session high/low plays
Pivot points derived from the previous day’s high, low and close provide intraday support and resistance levels. On a 15‑minute chart these levels can act as magnets for price and serve as objective areas to take binary trades.
How to use a 15-minute binary option strategy
This style blends trend direction with confirming indicators to sharpen trade accuracy. It works best when the market shows strong direction, not when prices move aimlessly or sideways. The focus is on building a consistent, repeatable process to identify quality setups rather than reacting to every small fluctuation. For many traders, the 15-minute binary option approach provides structure and a steady pace that supports consistency.
Step one: Identify the market trend
Start by determining the market direction with a simple indicator such as the 50-period Exponential Moving Average (EMA). Place trades in line with the broader trend to improve your win rate, and avoid entering the market when it is flat or lacks momentum. For beginners, it is helpful to wait until at least three candles move in the same direction before opening a position. In an uptrend, watch for higher highs and higher lows, while in a downtrend, expect lower highs and lower lows.
Step two: Confirm with technical indicators
After spotting the trend, confirm your setup with supporting indicators such as the RSI or stochastic oscillator. An RSI above 60 strengthens a bullish case, while a reading below 40 supports a bearish outlook. When the RSI falls between 40 and 60, it usually signals low conviction, so it’s often better to skip the trade.
Step three: Timing the entry
Good timing is just as important as good analysis. Wait for the current candle to close before entering the trade to avoid acting on noise. Always double-check that your indicators support the trend before committing. That’s what makes a binary options’ 15-minute strategy effective, it’s not just about speed, but precision.
How to optimize performance on 15-minute charts
Improving results on 15-minute charts takes more than just knowing a basic setup. To trade effectively, you need to refine your approach, this includes selecting the right asset, trading at optimal times, staying disciplined, and practicing your strategy before using real funds.
Choosing the right asset and time of day
When choosing an asset, it is best to focus on those with consistent volatility and strong liquidity, such as major Forex pairs, actively traded stocks, or popular commodities. Assets with thin trading volume should be avoided, since they often produce choppy or delayed movements that make analysis and execution more difficult.
Best trading times
- In Forex markets, aim to trade during overlapping sessions such as London and New York for stronger momentum and clearer trends.
- In stock trading, the first and last trading hours are often the most active, offering better trade setups.
- Try to avoid quieter sessions, where price tends to move in small, indecisive ranges.
Another important aspect of consistency is steering clear of overtrading and emotional decisions. Trading too often tends to reduce setup quality and increase unnecessary losses. Revenge trading and similar emotional reactions usually lead to poor entries, higher risks, and unpredictable results.
Finally, discipline is what separates long-term success from short-lived gains. Setting a daily trade limit helps control exposure, while keeping a trading journal allows you to analyze decisions and identify emotional missteps. Above all, sticking to your trading rules and resisting impulsive trades ensures a more sustainable approach to the markets.
Using demo accounts to test your strategy
Demo trading gives you a chance to experiment with new ideas without risking your capital. It helps you build confidence in your method before going live with it. You also learn to fine-tune your approach based on real-time feedback from the market.
How to use demo accounts effectively
- Treat your demo account just like a real one, follow your trading rules and set specific performance goals.
- Review your trade history regularly to identify what’s working and where improvements are needed.
- Only transition to live trading once your 15 min binary options strategy shows consistent and reliable results.
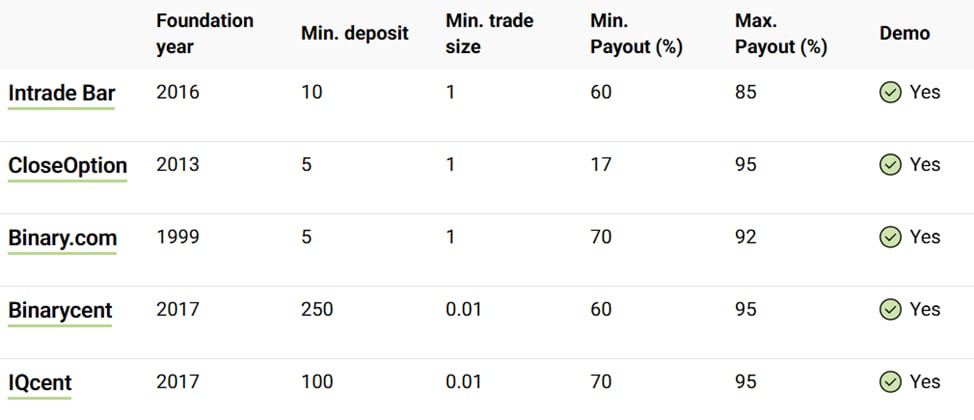
To help you make an informed choice, here’s a comparison of the best binary options brokers, based on trading conditions, regulation, features, and user feedback:
Conclusion
The 15-minute strategy is less about rushing and more about precision. Each trade moves to its own rhythm, and if I tune in carefully, the right entry becomes visible before it appears obvious to others. The edge isn’t about reacting quickly but about staying clear-headed and patient. The market doesn’t reward panic; it favors those who know the right moment to act—and the discipline to wait when nothing is clear.
Post a comment